 ELXR
// Guide · Ableton Live
How to see a spectrogram in Ableton Live
// Quick answer
A spectrogram shows frequency over time, so you see when each sound plays as well as where it sits. Live's Spectrum device shows a live frequency curve but not its history. For a scrolling spectrogram, add an analyzer device that has one.
Spectrum vs spectrogram
- Spectrum analyzer: a curve of how loud each frequency is right now. Good for balance: too much low end, a harsh peak.
- Spectrogram: a scrolling picture with time across, frequency up, and brightness for level. Good for things that change: a kick's pitch drop, a riser, sibilance on certain words, a resonance that only rings now and then.
What Live's Spectrum does
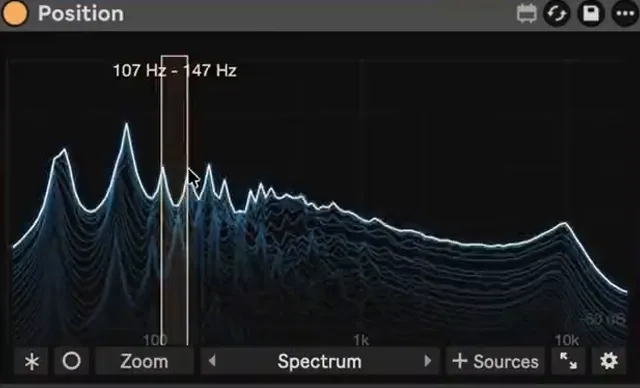
Live's Spectrum device shows the current spectrum as a line or bins, with adjustable block size, averaging and scale. It's great for a quick balance check, but it has no time history, so it can't show you when a sound happens.
Getting a spectrogram
- Put Position after the sound you want to see, or on the master.
- Switch to the Spectrogram view: frequency over time, scrolling as the song plays.
- Click any band in the Spectrum to hear just that range, which is the quickest way to find what's causing a peak.
- Add other tracks as Sources to compare them, for example a kick and a bass, in their own colors.
- Use Freeze to hold the picture while you look closer.
What to look for
- Kick and bass: do their bright low bands land at the same time on the same frequencies?
- Sibilance: bright flashes around 5–10 kHz on S and T sounds in a vocal.
- Resonances: a thin horizontal line that keeps ringing after the note.
- Risers and sweeps: diagonal lines that show the direction and speed of the movement.